bestFit
About
bestFit is a synchronous python module that uses matplotlib and numpy to plot the best fit line of a given set of coordinates.
Github page: https://github.com/SebassNoob/bestFit
Dependencies:
matplotlib
numpy
To import: use import bestFit.main as bf
take note of the capitalisation.
Quickstart
This is how to plot a basic graph based on a list of coordinates.
Create a file named
index.pyin rootTo import the module, use
import bestFit.main as bf(or any similar shorthand)Define a list of coordinates, for example:
my_coords = [(0,0),(1,3),(2,3),(4,7),(8,0),(-1,0.33)]Plot the graph like this:
import bestFit.main as bf

my_coords = [(0,0),(1,3),(2,3),(4,7),( 8,0),(-1,0.33)]

      def check_for_anomaly(x,y):
      #checks for anomalies in points, eg: if the x coordinate of a given point is >1000, return True else return False (or None)
      if x>1000:
              return True
      return None
# creates a linear line from the given coordinates, with a green line and green points.
line = bf.create_line_from_raw(line_name="mygraph",linestyle="g-",pointstyle="go"coords = my_coords, n_power =1 , anomaly_check = check_for_anomaly)
line.plot()
show_graph()
Then, run in console:
python3 index.pyA line with name
mygrapha green solid plotted line, and points on that line displayed as green circles, should be shown.
Classes
class Coordinate(x: str or float, y: str or float, anomaly: bool = False)
The basic coordinate: contains a x and y variable, as well as if the coordinate is an anomaly.
Anomaly values are ignored when plotting a best fit line.
Attributes:
x (float)
A x coordinate.
y (float)
A y coordinate.
anomaly (bool, optional)
Defaults to False. If True, point is considered an anomaly and will not be taken into consideration when plotting.
Methods:
__str__
returns (x,y)
__repr__
returns repr(self.__dir__())
class Line(list_of_coords: list, n_power: int)
A Line object. list_of_coords is a list containing Coordinate objects.
n_power refers to the polynomial power when finding the best fit line. For example, when n_power = 1, Line is linear in the form y = mx + c, but when n_power = 2, Line is a curve in the form y=ax^2 + bx + c.
Attributes:
name (str, optional)
The name of the line used and displayed in the legend.
This defaults to a string of numpy.ndarray with the coefficients of the line.
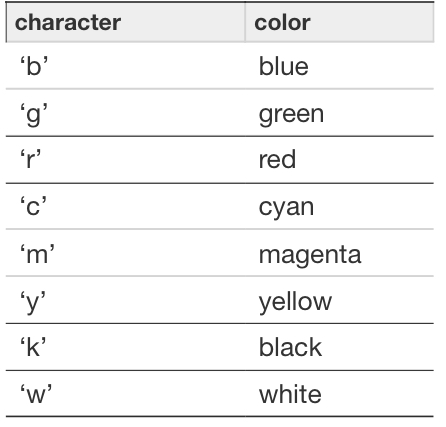
linestyle (str) and pointstyle (str)
The style of the best fit line and the points plotted. Defaults to “-” and “o” respectively. Available types:
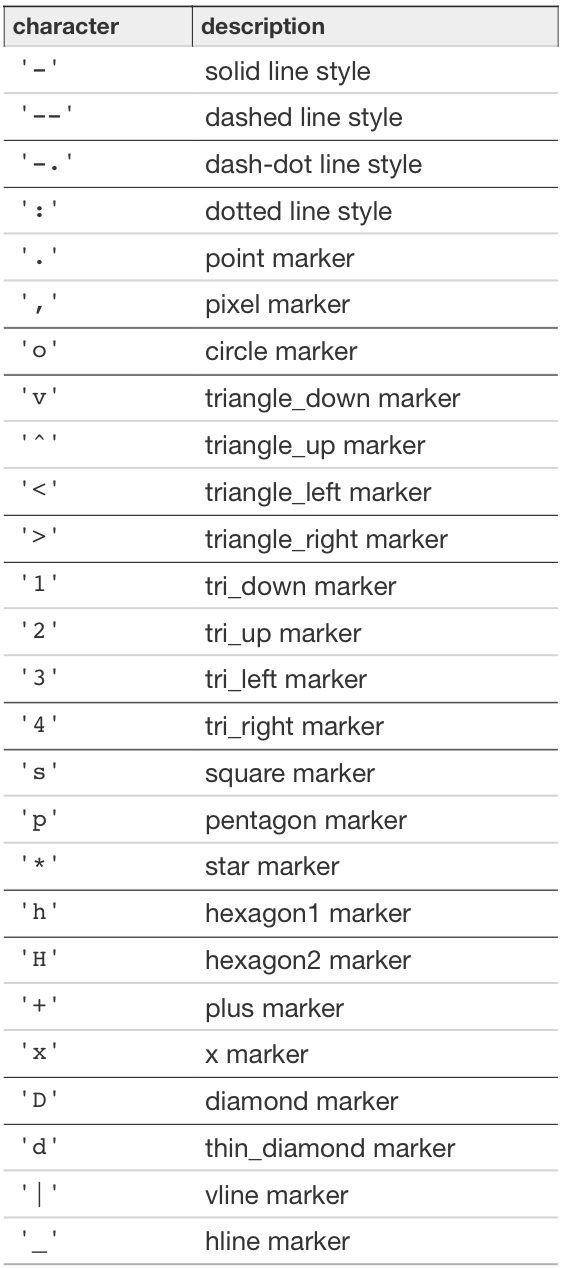
Adapted from https://matplotlib.org/2.1.2/api/_as_gen/matplotlib.pyplot.plot.html
eg:
"b-" => a blue solid line
"w-." => a white dash-dot line
"ro" => red circle markers
"kx" => black x markers
x_points (list)
A list of x points provided
y_points (list)
A list of y points provided
invalid_x_points (list)
A list of x points that are considered “anomalies”. See Coordinate class.
invalid_y_points (list)
A list of y points that are considered “anomalies”. See Coordinate class.
polynomial_coefficients (list)
The coefficients to the solved line equation. eg. [1.0,2.0,3.0] is x^2 + 2x + 3
solved_y (list)
Defaults to y_points. If smoothen_line is called (See smoothe_line class function), this will contain more values for y solved with polynomial_coefficients.
solved_x (list)
Defaults to x_points. If smoothen_line is called (See smoothen_line class function), this will contain more values for x solved with polynomial_coefficients.
self.smoothness (int)
The “smoothness” of the graph. A greater value means more smooth. Defaults to None
n (int)
The power of n used for calculation.
Methods:
__str__
returns a list of tuples in the form (x,y)
eg. [(0,0),(1,2),(2,4)]
__repr__
returns repr(self.__dir__())
calculate()
Based on given valid points, this will find the coefficients of the polynomial of the best fit line, then calculate solved_x and solved_y, then sort.
returns None
smoothen_line(accuracy: int= None)
Smooths a line. Useful when n_power > 1
returns (self.solved_x, self.solved_y)
plot()
Plots the line, but does not show it.
returns None
add_point(coord: Coordinate)
Adds a point to the Line object. Parameter passed must be a Coordinate object. eg. line.add_point(Coordinate(1,2))
returns (x,y) where x and y are the x and y values of the Coordinate object.
remove_point(coord: Coordinate)
Removes a point from the Line object. Parameter passed must be a Coordinate object. eg. line.remove_point(Coordinate(6,9))
returns (x,y) where x and y are the x and y values of the Coordinate object.
Functions
Note: args marked after * are keyword-specified. Google “python **kwargs” for more info.
eg: .. code-block:: python
import bestFit.main as bf
#where some_method is defined as follows: #some_method(arg1,*,arg2)
bf.some_method(2,arg2=”hello world”)
create_line_from_file(*,line_name:str =None,linestyle = None,pointstyle=None, path: str, n_power: int=1, anomaly_check=None)
Creates a line from a .txt (only) file. An example of a txt file:
1,2
3,4
5,6
-1.2,4
0,0
line_name (str, optional): the name of the line to be shown on the legend. Defaults to the coefficients of the polynomial of the line.
linestyle (str): The style of the line. See the Line.linestyle attribute for list of accepted styles.
pointstyle (str): The style of the points. See the Line.pointstyle attribute for list of accepted styles.
path (str): the path to your file
n_power (int, optional): the n_power of your line (See Line object)
anomaly_check (function, optional): a function of parameters (x,y). Checks if a point specified is invalid and returns True if so.
eg.
def check(x,y):
  if y>0:
    return True
  return False
Returns a Line() object.
create_line_from_raw(*,line_name:str =None,linestyle = None, pointstyle = None,coords:list, n_power: int=1, anomaly_check=None)
Creates a line from a list of tuples containing x,y points.
coords (list): list of coords
eg. hi = [(0,0),(1,1),(2,3)]
line_name (str, optional): the name of the line to be shown on the legend. Defaults to the coefficients of the polynomial of the line.
linestyle (str): The style of the line. See the Line.linestyle attribute for list of accepted styles.
pointstyle (str): The style of the points. See the Line.pointstyle attribute for list of accepted styles.
n_power (int, optional): the n_power of your line (See Line object)
anomaly_check (function, optional): a function of parameters (x,y). Checks if a point specified is invalid and returns True if so.
eg.
def check(x,y):
  if y>0:
    return True
  return False
Returns a Line() object.
show_graph(block=None)
The MOST IMPORTANT METHOD. Shows the entire graph based on the Line() classes initialised.
block (bool, optional): Blocks the code flow to show the graph. Defaults to True.
close_graph()
Closes the current graph displayed.
save_fig(path, format)
Saves the graph to a specified filename.
path (str): Path of the file one wants to save to.
format (str, optional): Format of the file saved. Defaults to “png”
The end:)